UEG's educational platform for gastroenterology education bringing recordings, courses, guidelines, and more together in one place.
Most popular content
Rate for better recommendations!
Your feedback helps us show you more of what you like and less of what you dislike!
Log in to access this content.
Free for all myUEG account holders. Your access level is set automatically based on your occupation. Medical professionals get full access to all content. If you are a non-medical user, you can only access UEG Week content from congresses you attended.
Not sure what you can access? Learn more about account types.
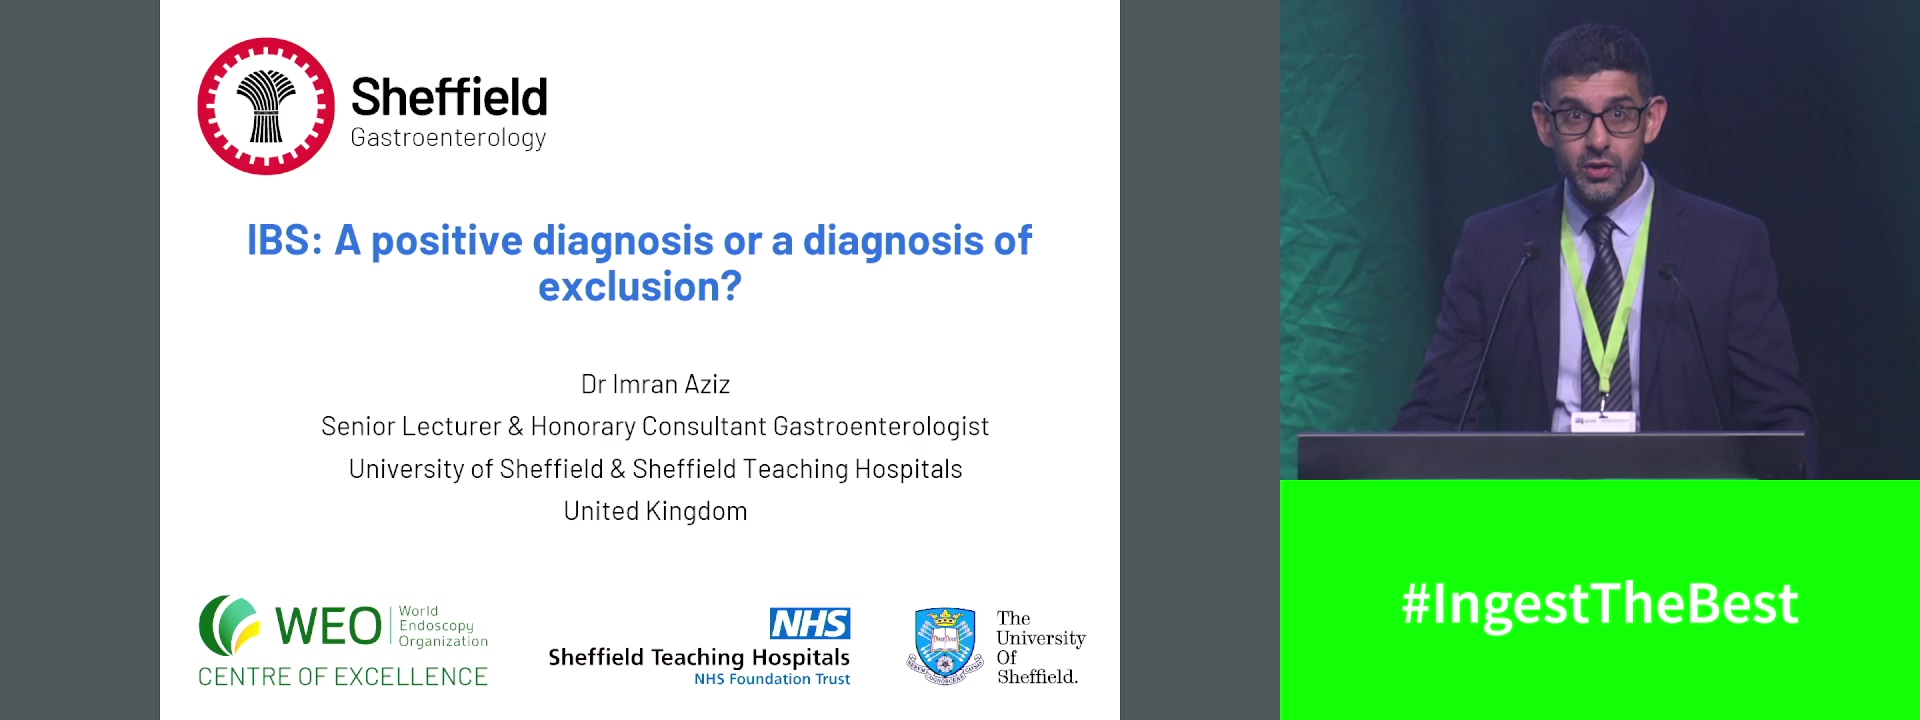
IBS: A positive diagnosis or a diagnosis of exclusion?
1 University of Sheffield, Sheffield, United Kingdom
Event
Topics
Citation
Published

Log in to access this content.
Free for all myUEG account holders. Your access level is set automatically based on your occupation. Medical professionals get full access to all content. If you are a non-medical user, you can only access UEG Week content from congresses you attended.
Not sure what you can access? Learn more about account types.
Chronic constipation (Complete Session)
Event
Topics
Session
Citation
Published

Log in to access this content.
Free for all myUEG account holders. Your access level is set automatically based on your occupation. Medical professionals get full access to all content. If you are a non-medical user, you can only access UEG Week content from congresses you attended.
Not sure what you can access? Learn more about account types.
PPIs under the microscope: The must-know European guidelines!
1 Vilnius university Santaros Klinikos, Vilnius, Lithuania
Event
Citation
Published
Log in to access this content.
Free for all myUEG account holders. Your access level is set automatically based on your occupation. Medical professionals get full access to all content. If you are a non-medical user, you can only access UEG Week content from congresses you attended.
Not sure what you can access? Learn more about account types.
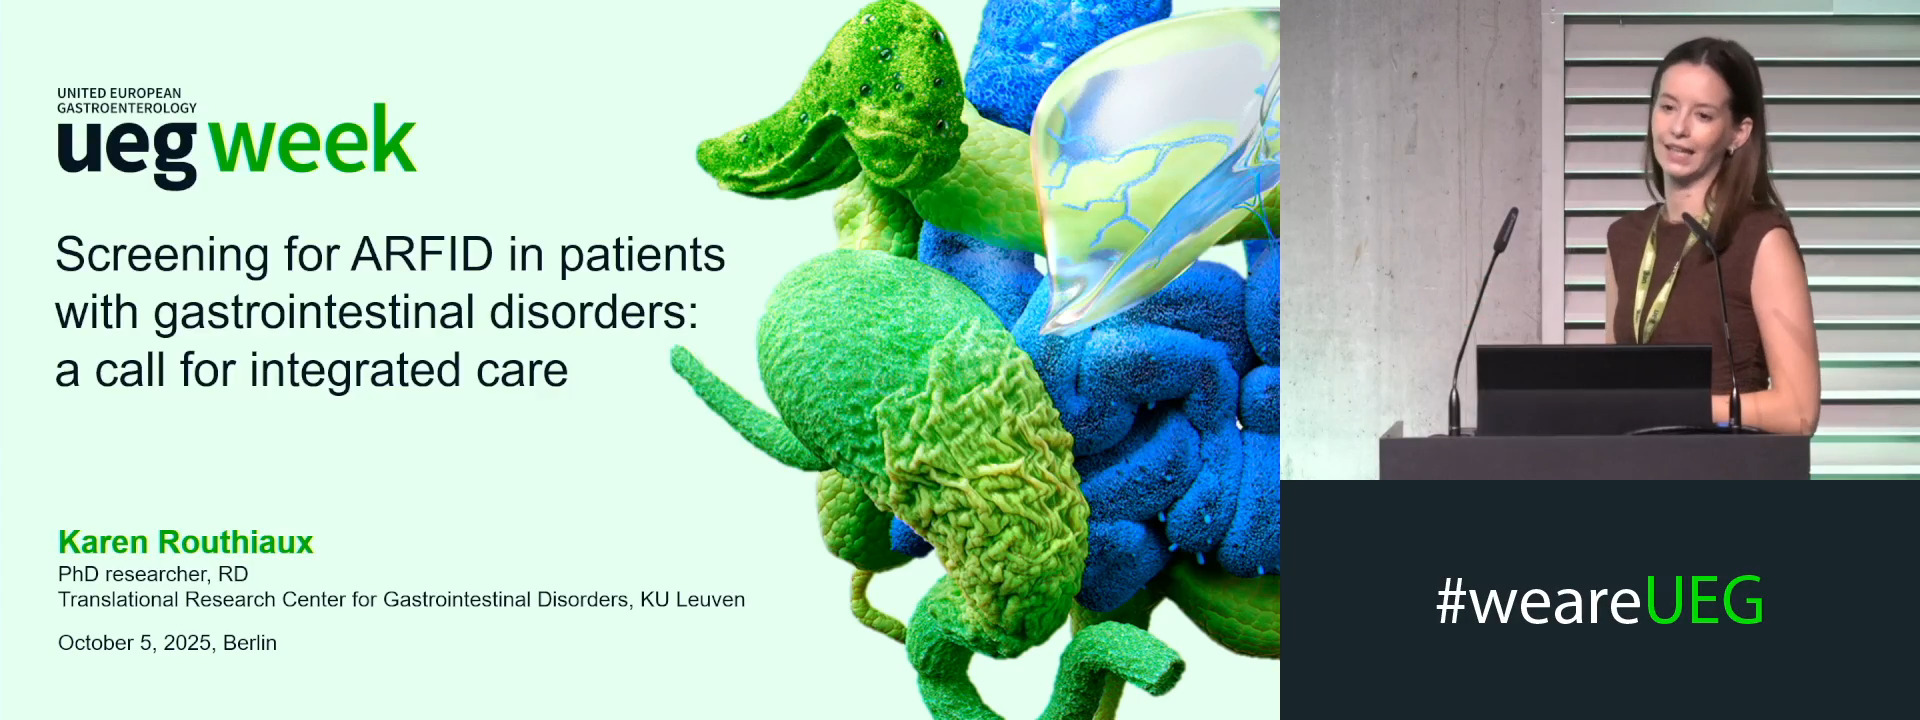
SCREENING FOR ARFID IN PATIENTS WITH GASTROINTESTINAL DISORDERS: A CALL FOR INTEGRATED CARE
Karen Routhiaux 1, Karen Van den Houte 1, Lukas Balsiger 2, Michael P. Jones 3, Karlien Raymenants 1, Cedric Van de Bruaene 1, Bert Broeders 1, Annelies Verheyden 1, Helen Burton Murray 4, Tim Vanuytsel 5, Jan Tack 5
1 KU Leuven, Leuven, Belgium
2 KU Leuven, Leuven, Belgium|||University of Bern, Bern, Switzerland
3 Macquarie University, North Ryde, Australia
4 Massachusetts General Hospital/Harvard Medical School, Boston, United States
5 KU Leuven, Leuven, Belgium|||UZ Leuven, Leuven, Belgium
Event
Topics
Submission format
Citation
Published
Log in to access this content.
Free for all myUEG account holders. Your access level is set automatically based on your occupation. Medical professionals get full access to all content. If you are a non-medical user, you can only access UEG Week content from congresses you attended.
Not sure what you can access? Learn more about account types.
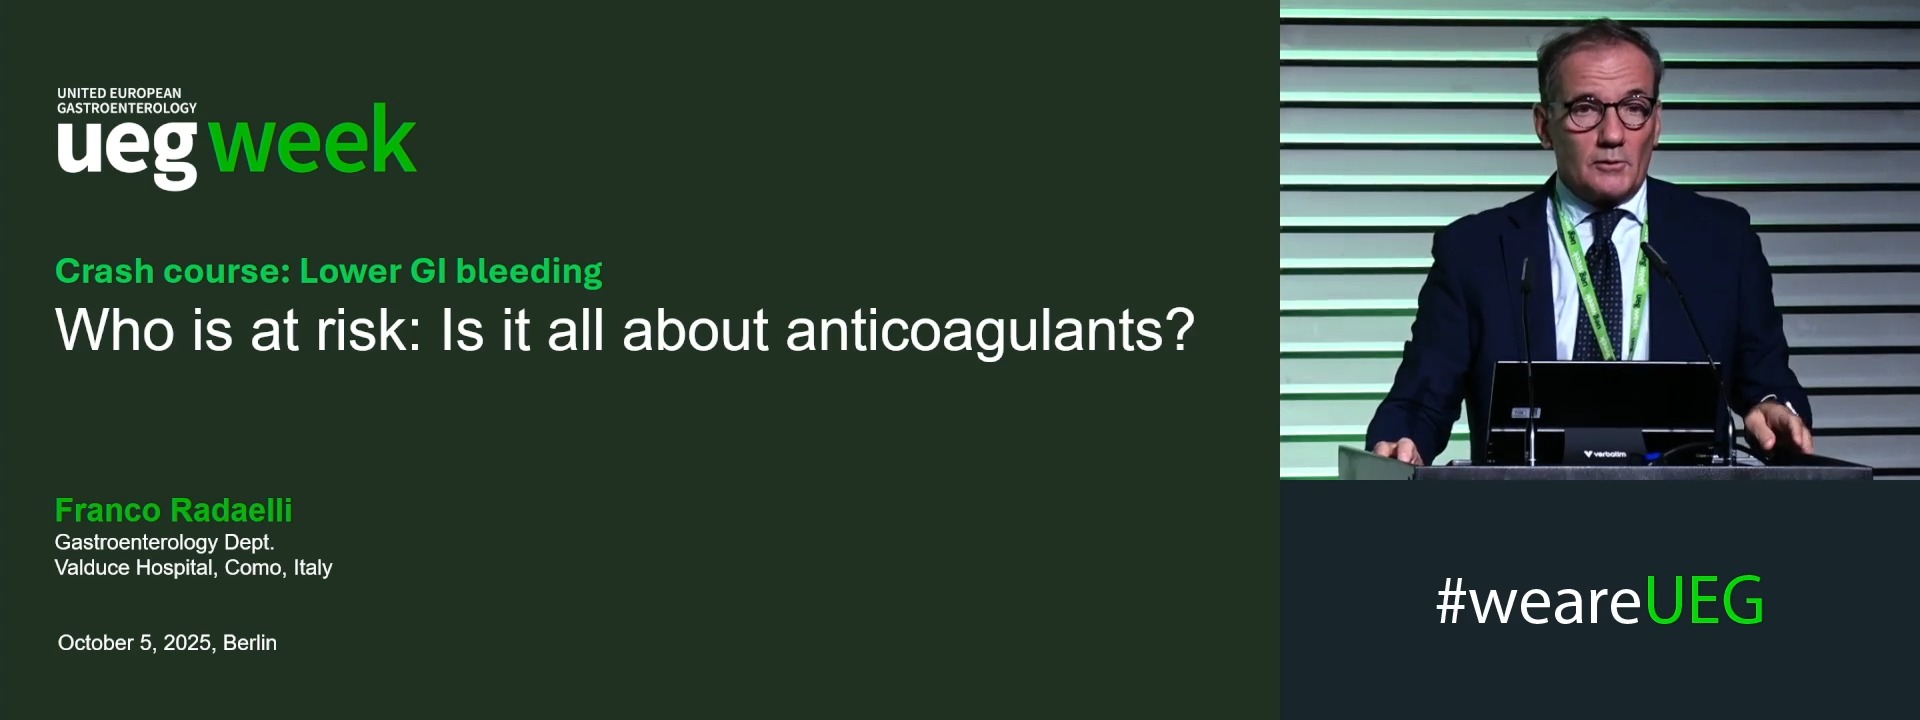
Who is at risk: Is it all about anticoagulants?
1 Valduce Hospital, Como, Italy
Event
Topics
Session
Citation
Published
Log in to access this content.
Free for all myUEG account holders. Your access level is set automatically based on your occupation. Medical professionals get full access to all content. If you are a non-medical user, you can only access UEG Week content from congresses you attended.
Not sure what you can access? Learn more about account types.
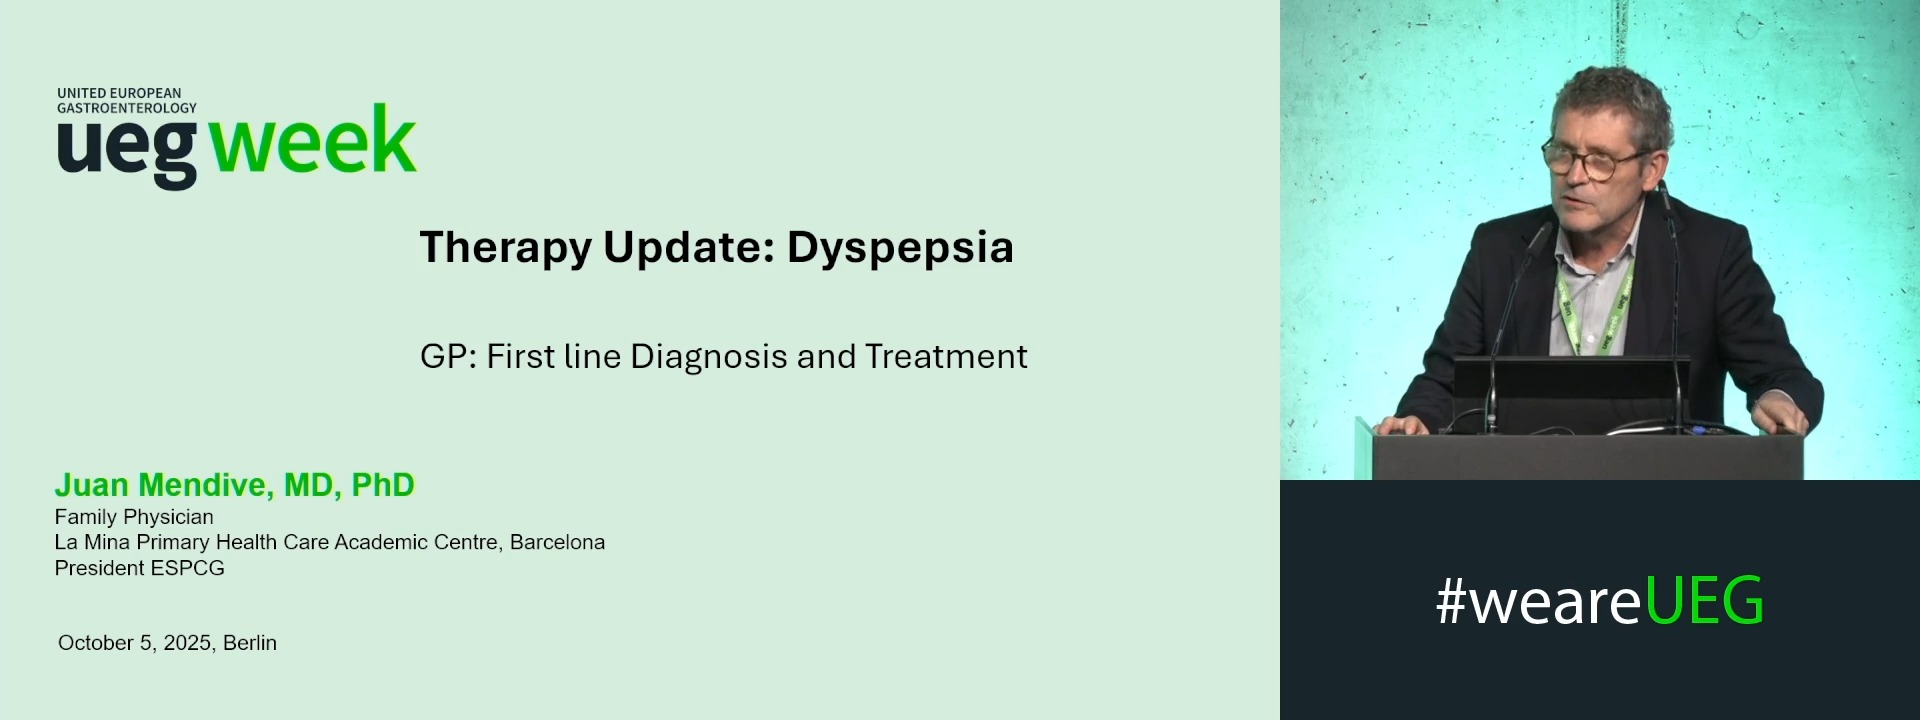
GP: First line diagnosis and treatment
1 European Society for Primary Care Gastroenterology (ESPCG), Sant Adrià de Besòs ( Barcelona), Spain
Event
Session
Citation
Published
Log in to access this content.
Free for all myUEG account holders. Your access level is set automatically based on your occupation. Medical professionals get full access to all content. If you are a non-medical user, you can only access UEG Week content from congresses you attended.
Not sure what you can access? Learn more about account types.
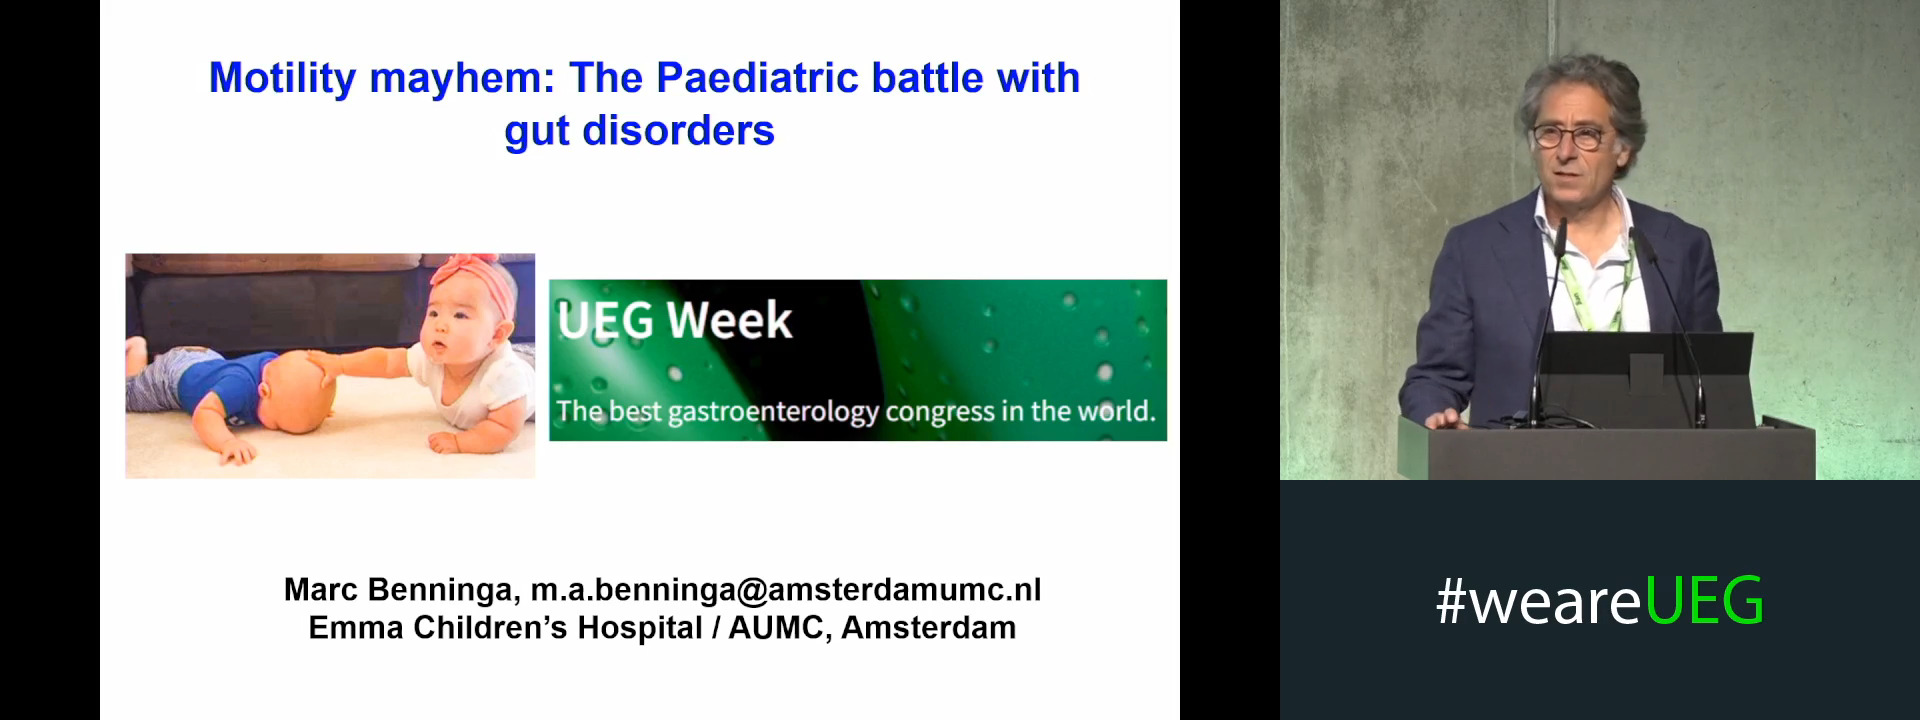
Motility mayhem: The paediatric battle with gut disorders
1 Academisch Medisch Centrum Onderzoekschool Oncologie Pediatrics and Pediat. Surgery - Dep. Of Pediat, AZ Amsterdam, Netherlands